en ru lv

Information

 / 

Data export

Types of Export  
selected_component

The Service offers data export of three types:

  • as general statistics (link "Download statistics" in  section "Statistic");
  • as answers from one respondent (link "Download data" on an answers' page from one respondent);
  • and for a more detailed analysis in the form of all collected data for a chosen form (link "Download data" in sections "Statistics" and "Respondents").

component_props

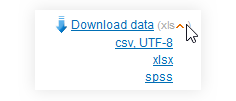
The last version, in turn allows to choose a type of a file in which the data will be preserved: XLS, XLSX, CSV or SPSS. To choose it, point the mouse cursor at a type indicated in brackets after the reference. By default, a most convenient type for use is offered, considering the fact that it must be formed quickly enough. For questionnaires with a small number of respondents the type XLS will be offered. Otherwise, it is XLSX, or even CSV. Exception is for questionnaires with a big number of possible answers to questions. For such questionnaires, the XLS type is not offered initially for the reason of technical restrictions.

The CSV type is not able for having no signs of data formatting. When opening such a file in Excel or in any similar program used for operating with electronic tables, you have yourself to correct the size of columns and show the program in whose graphs you have figures, time and dates. Otherwise, Excel and similar programs cannot correctly analyze your data when necessary.

The "SPSS" format is specially provided for a program of the same name and its alternatives. Unfortunately, we cannot form data in files like SPSS for technical reasons, and therefore, when downloading data in "SPSS" format the user will get XLS, XLSX or CSV, according to the above-mentioned principe. The programs of processing SPSS files must open up these types of files without problems.

Correction of CSV formatting as taken for Excel

To bring data from a CSV file to a type offered in XLS and XLSX files, you have to use this activity:

selected_component
Correct the size of columns

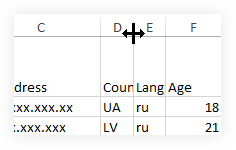
To alter the size of one graph, point the mouse cursor at the separator between a needed graph and a next one in the table heading (for example, between the names of "D" and "E" graphs), and when the mouse cursor changes into a vertical line with arrows, press the left mouse button and draw it to the side needed, or produce a double click with the left mouse button to let the size of a left-hand column equal its content.

And to make it possible for all the columns to equal their contents, click at the upper left-hand corner of the table (when all table data are made shown), after which, double click at the separator between and graphs in the table heading.

selected_component
Set up the correct type of data for columns needed

To set up the correct type of data for a graph, click the left mouse button at the heading for a needed graph (e.g. at the heading of "D" column).

To select a few successively running graphs, click the left mouse button at the heading of the first graph, and without buttoning up, draw left or right until all needed graphs are selected.
To select a few graphs running unsuccessfully, select the first of them, after which, holding the "Ctrl" button down, click at the heading of the rest.

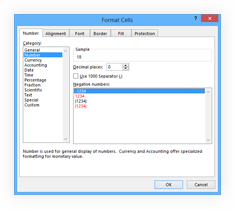
When the needed graphs are selected, hold the "Ctrl" button down, click the left mouse button at the text headings of grahps selected, so to remove a selection function from them, and, consequently, not to bring their formats to numbers or dates. Next, click the right mouse button at any of spaces selected. In the open-up menu, select "The Cell Format". In the opened dialog window, in the first nest, select a needed type of data and press "OK".